listifi is an app that attempts to make lists viral. In order to increase engagement, it's important to make the open graph images when posting to social media dynamic, vibrant, and enticing enough to click on them.
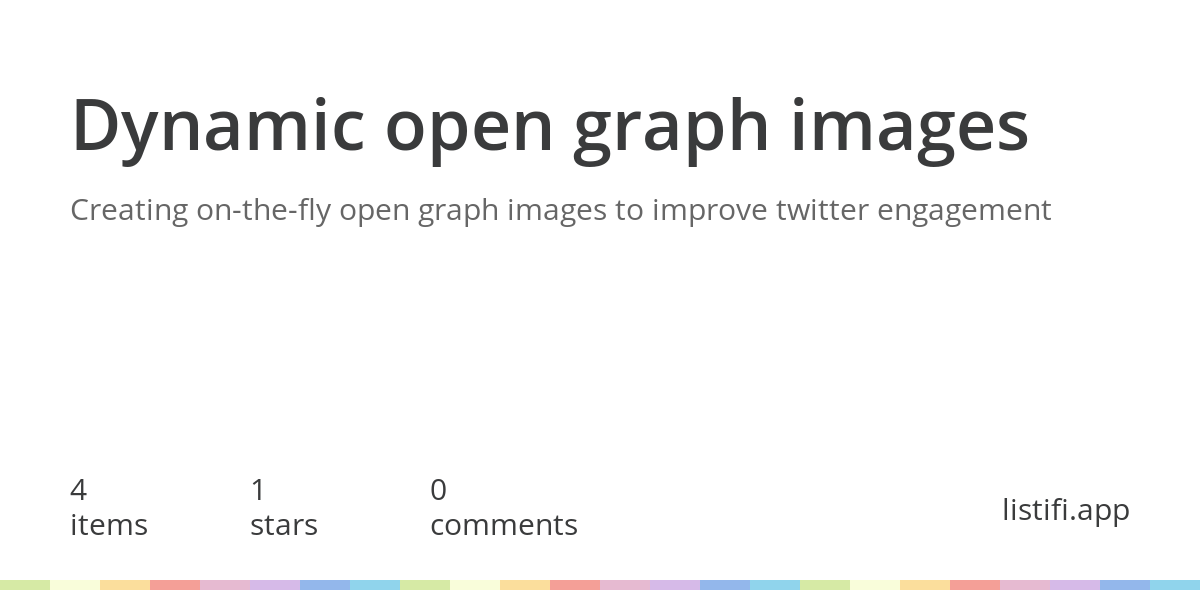
Here is an example of the latest open graph images in listifi
In this article I discuss the different approaches I took to build dynamic, on-the-fly open graph images for listifi.
Inspiration #
There was a recent blog post by Github that discussed how they built their open graph images for github repositories.
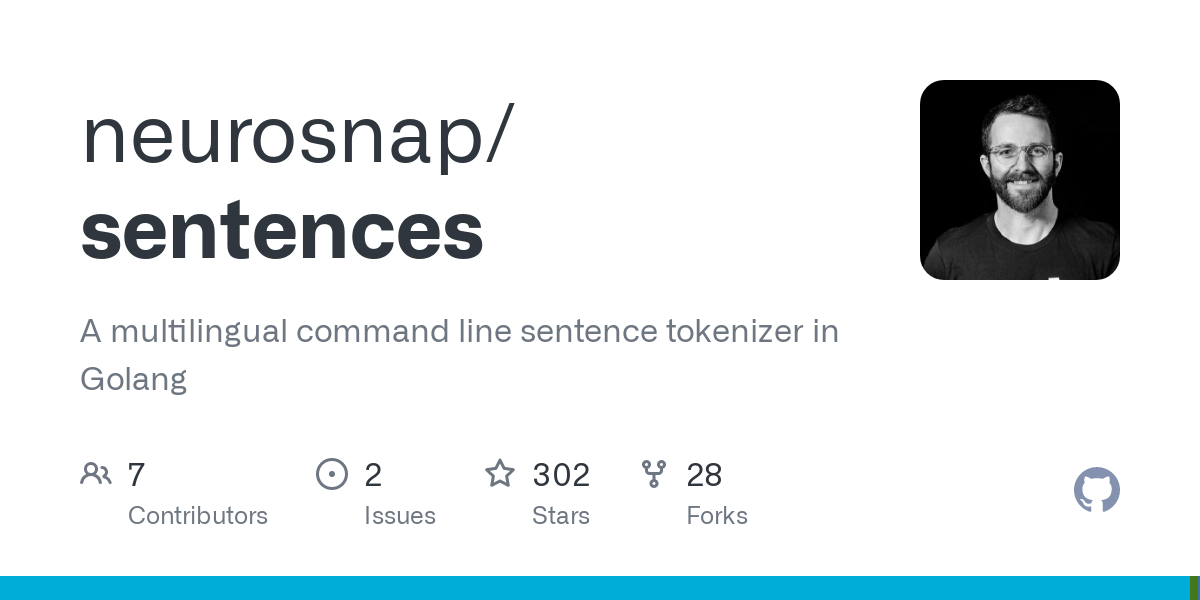
As you can see from the image above, it uses information from the repository to build the image. Not only does it include the name of the repo and description, it also includes things like stars, contributors and the languages used. This breathes life into their open graph images and makes you want to engage with them.
Their underlying implementation was to leverage puppeteer which is a headless chromium browser that takes a screenshot of their HTML. This works great because you can generate the screenshot using html, css.
I thought to myself, "if it's good enough for Github, it'll be good enough for listifi." So I started implementing my new open graph service using puppeteer.
Using puppeteer #
I won't discuss the intial implementation because it's basically how github described it.
I deployed this implementation and it worked, but it was really slow on my tiny f1.micro. Some images would take up to 5 seconds to generate. I decided to try solving the problem by vertically scaling my VM to a g1.small. That definitely helped but it only brought image generation time down by about 1 second.
I decided to add redis and store the image blob there so the first request will be slow, but every other request would be near instant. I also figured I could fire off a request to my service when the user navigates to the list detail page that hosts the image so when they actually share the list the image will already be cached. Here is the diff that adds redis.
After adding redis and getting the cache right things were very snappy. It was near instant. I decided to clear the cache for an image by storing an expiresAt timestamp set for the next day at the same time. This would allow images to get updated on a daily basis.
Great! I'm done, right? Not quite.
Using canvas #
A friend suggested I try to generate the image via SVG or using canvas and convert that to a PNG. As you can see with the puppeteer implementation, not only was it slow but I had to add a ton of dependencies to my stack as well as a redis server just to get adequate performance. canvas on the other hand, was much easier to install and setup only required a few external dependencies. It's possible with the canvas approach I wouldn't even need redis and the image could be generated on-the-fly for every request without any caching.
flavicopes article on using canvas.
The canvas implementation can be broken up into a few parts.
First we need to build the canvas and register our fonts:
 1log(`generating image for ${username}/${listname}`);
 2const width = 1200;
 3const height = 600;
 4const canvas = createCanvas(width, height);
 5const ctx = canvas.getContext("2d");
 6
 7registerFont("./public/OpenSans-Regular.ttf", {
 8  family: "opensans",
 9});
10registerFont("./public/OpenSans-SemiBold.ttf", {
11  family: "opensans",
12  weight: "bold",
13});
14
15ctx.fillStyle = "#fff";
16ctx.fillRect(0, 0, width, height);
17const marginX = 70;
18const widthLength = width - marginX * 2;
Since open graph images have a fixed height, it made the following calculations much easier to figure out. Next we need to start building the image.
1const titleFontSize = 70;
2ctx.font = `bold ${titleFontSize}px opensans`;
3ctx.fillStyle = "#3A3B3C";
4const titleText = list.name;
5const lines = wrapLines(ctx, titleText, widthLength).slice(0, 2);
6for (let i = 0; i < lines.length; i += 1) {
7  const line = lines[i];
8  ctx.fillText(line, marginX, 150 + titleFontSize * i);
9}
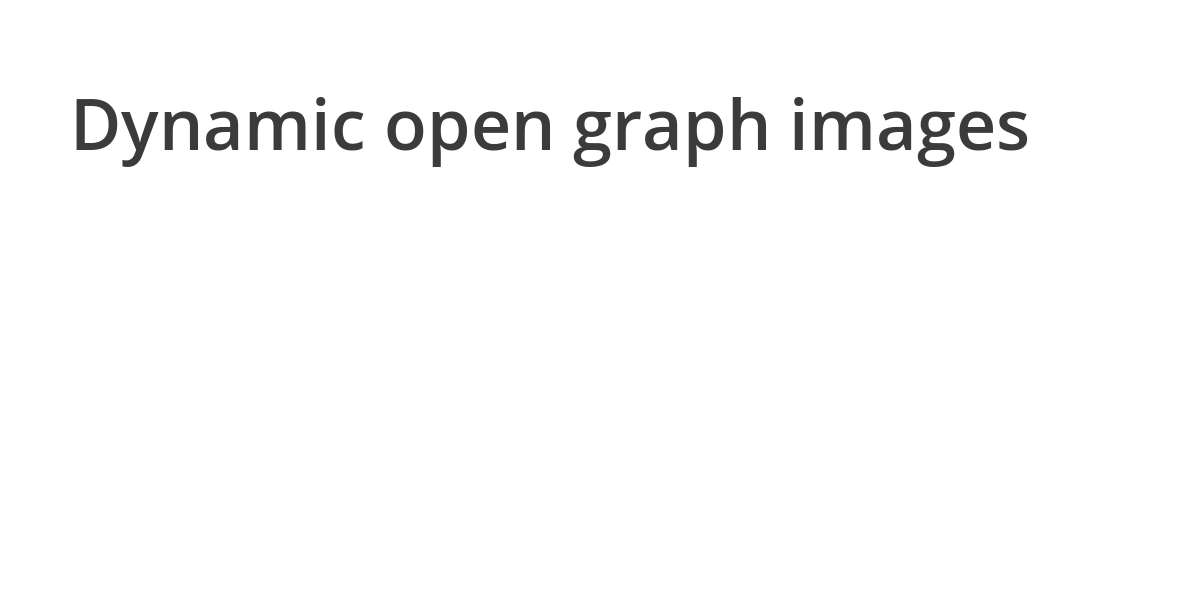
This is where I hit my first issue. How do you have text that will wrap automatically? I found a stack overflow post that figured out how to do it reliably:
 1function wrapLines(
 2  ctx: NodeCanvasRenderingContext2D,
 3  text: string,
 4  maxWidth: number,
 5) {
 6  const lines = [];
 7  let result = "";
 8  let i = 0;
 9  let j = 0;
10  let width = 0;
11
12  while (text.length) {
13    for (
14      i = text.length;
15      ctx.measureText(text.substr(0, i)).width > maxWidth;
16      i--
17    );
18
19    result = text.substr(0, i);
20
21    if (i !== text.length) {
22      for (
23        j = 0;
24        result.indexOf(" ", j) !== -1;
25        j = result.indexOf(" ", j) + 1
26      );
27    }
28
29    lines.push(result.substr(0, j || result.length));
30    width = Math.max(width, ctx.measureText(lines[lines.length - 1]).width);
31    text = text.substr(lines[lines.length - 1].length, text.length);
32  }
33
34  return lines;
35}
This will take the max width allowed and the original text and return an array of lines that ensures the text can fit inside the maxWidth. It worked exactly how I wanted it to so I didn't delve too deep into its implementation.
Another key piece here is that I only want to display a most 2 lines for both the title and the description. This was actually more difficult in html than it was with canvas. Because I had to figure out how to construct the lines based on the text and the max width, it was easy for me to slice the array and only return two lines. Nice.
Now I can build the description:
 1const subFontSize = 30;
 2ctx.font = `normal normal ${subFontSize}px opensans`;
 3ctx.fillStyle = "#666";
 4const descLines = wrapLines(ctx, list.description, widthLength).slice(0, 2);
 5for (let i = 0; i < descLines.length; i += 1) {
 6  const line = descLines[i];
 7  ctx.fillText(
 8    line,
 9    marginX,
10    150 + lines.length * titleFontSize + (subFontSize + 10) * i,
11  );
12}
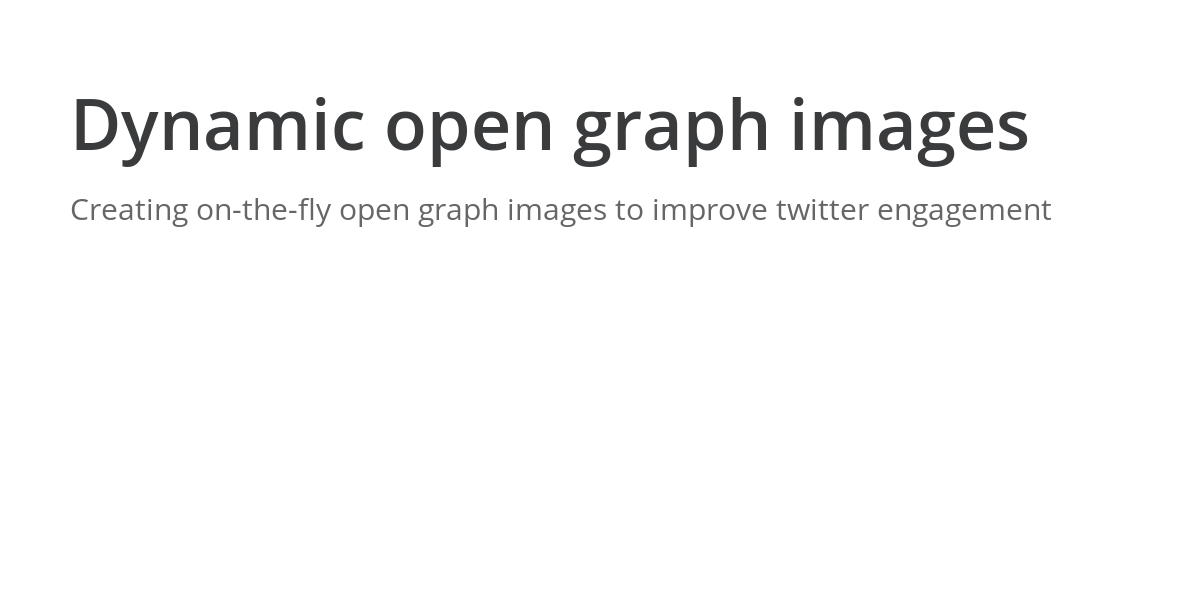
This was essentially a repeat of the title except with a different font size and color. I had to do some simple arithmetic based on the position of the title text and the size of the font.
Now I can fill in the metrics and branding row:
 1ctx.fillStyle = "#3A3B3C";
 2const metricsY = 500;
 3const metricsPad = 180;
 4ctx.fillText(`${itemIds.length}`, marginX, metricsY);
 5ctx.fillText("items", marginX, metricsY + 35);
 6
 7ctx.fillText(`${list.stars}`, marginX + metricsPad, metricsY);
 8ctx.fillText("stars", marginX + metricsPad, metricsY + 35);
 9
10ctx.fillText(
11  `${Object.keys(comments).length}`,
12  marginX + metricsPad * 2,
13  metricsY,
14);
15ctx.fillText("comments", marginX + metricsPad * 2, metricsY + 35);
16
17const text = "listifi.app";
18const textWidth = ctx.measureText(text).width;
19ctx.fillText("listifi.app", 1200 - marginX - textWidth, metricsY + 20);
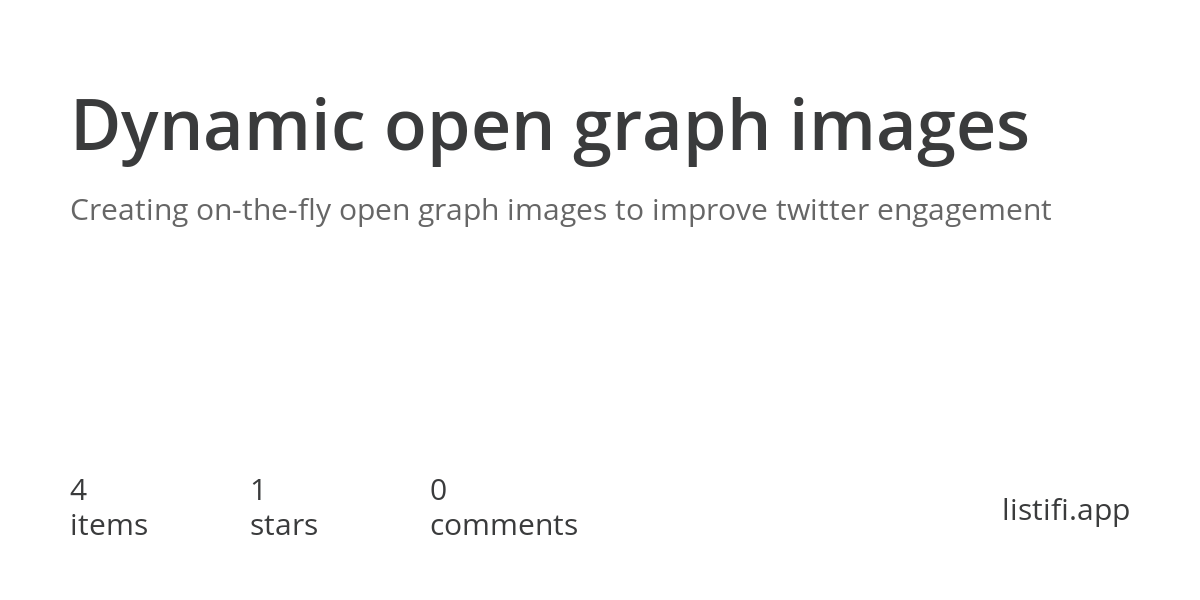
This was pretty simple, I just had to play around with the position of the row and the different metrics.
Finally, I need to display the rainbow branding that I use for listifi. In the app, this is generated by html and css, so I couldn't do that for my canvas implementation. Instead I decided to convert the rainbow into a PNG image with the exact dimensions I needed for this image (1200x10).
1const rainbow = await loadImage("./public/rainbow.png");
2ctx.drawImage(rainbow, 0, 580, 1200, 10);
That was very easy to build. Shout out to photopea for making image editing in the browser easy. Being able to open a webpage to manipulate an image is an awesome developer experience.
Finally I just need to convert the canvas to a PNG.
1const buffer = canvas.toBuffer("image/png");
Using koa it's easy to send a Buffer object as the response to my API endpoint.
You can see the final implementation here
What did I gain by switching to canvas? #
The result is pretty great. Generating the image takes a fraction of a second without using any caching mechanism.
This was a pretty huge win for me. I was able to remove a ton of dependencies, remove a cache mechanism, and I can always generate a fresh open graph image for each list detail page.
Shout out to Antonio for coming up with this recommendation!
You can see the end result here